Use Case: Cost optimization
know what to cut and what to keep
Consolidation fails when you can’t see what depends on what. Mugato reveals every source of infrastructure waste and connects each component to the business service it supports, so optimization is safe to execute.








How it works
FROM hidden costs to seven-dimensional rightsizing
Five capabilities that turn infrastructure cost optimization from a risky cost-cutting exercise into a dependency-aware, data-driven program.
Agentless discovery
Manual discovery misses shadow IT and unmanaged assets. Agent-based tools only see servers with agents installed, leaving zombie servers invisible.
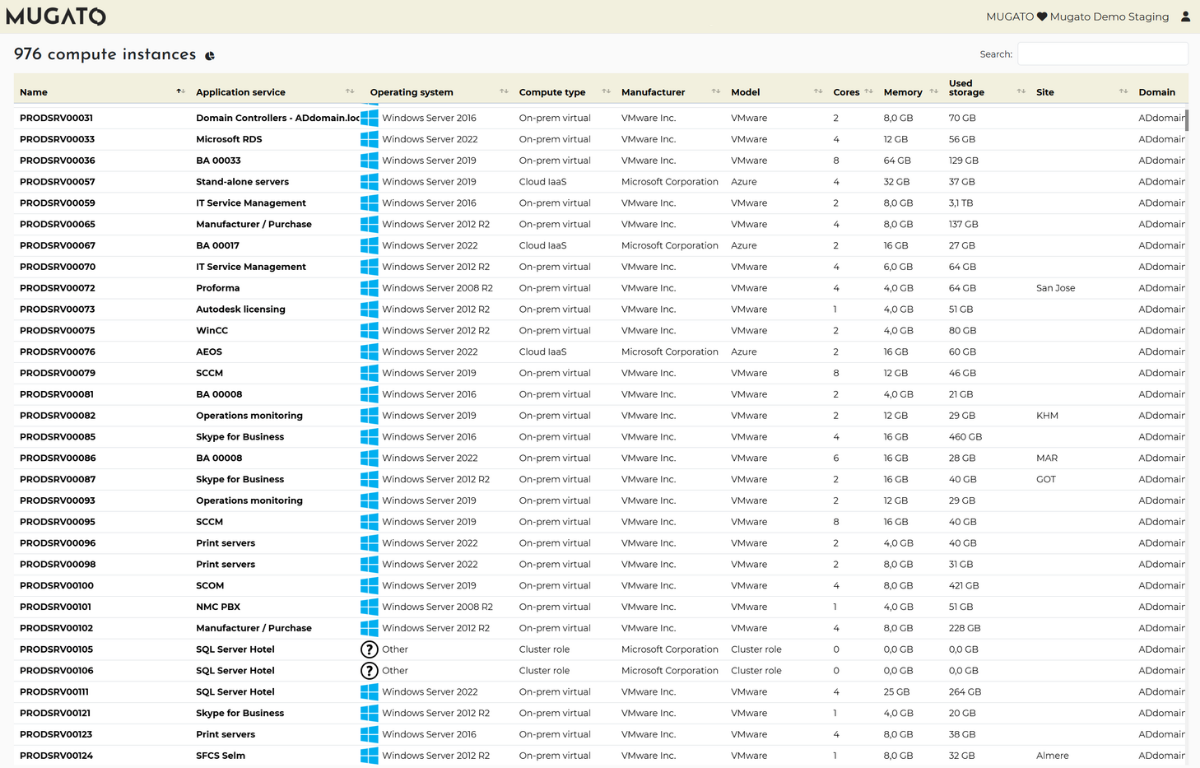
Mugato automatically discovers every device, application and connection across your entire environment without installing software on any endpoint, including zombie servers, shadow IT and unmanaged assets invisible to agent-based tools. You can’t optimize what you can’t see. Complete, agentless discovery exposes the full scope of waste before you make a single consolidation decision.
Seven-dimensional rightsizing
Traditional rightsizing uses a single metric, CPU utilization or EOL dates, missing the highest-impact optimization opportunities.
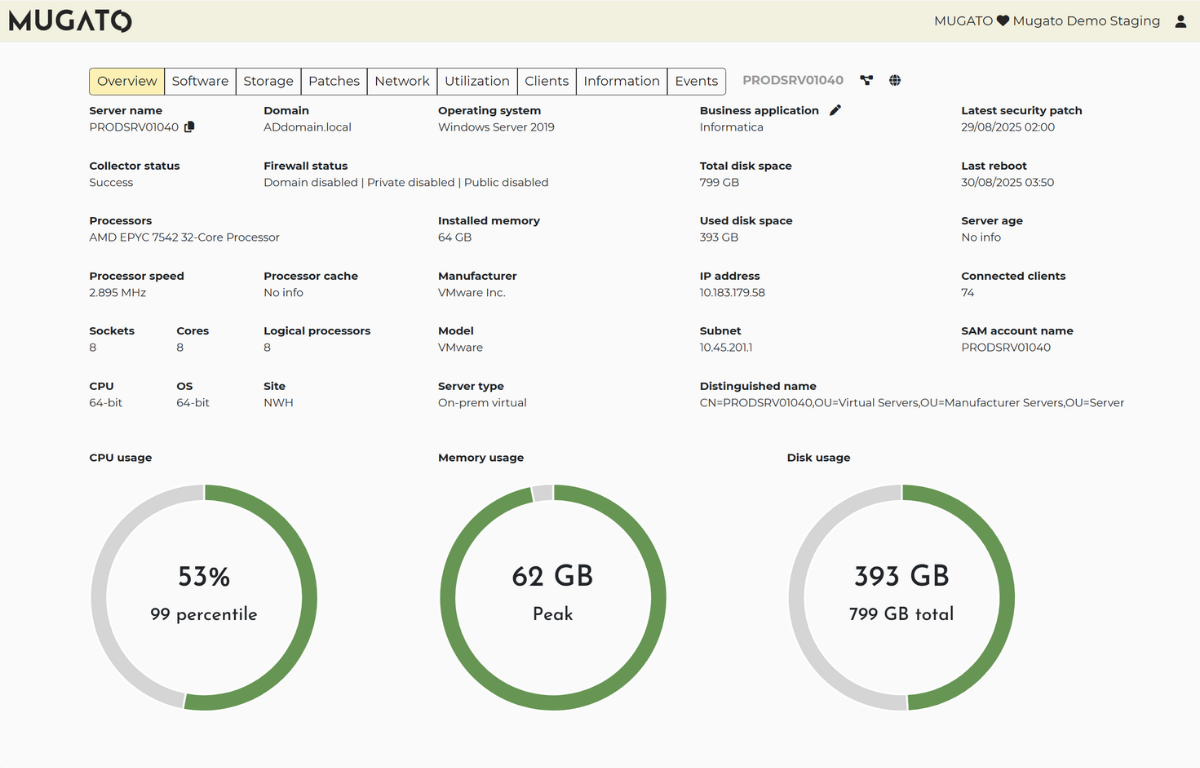
Mugato analyzes each infrastructure component across seven dimensions: compute use, technical debt, cybersecurity posture, licensing cost, management overhead, hardware age and consolidation opportunity. Analysis happens at the application-service level, revealing the true cost and risk profile of every asset so you can prioritize savings that maximize impact while protecting service quality.
Automated dependency mapping
Consolidation without dependency intelligence causes outages that erase savings and damage stakeholder credibility.
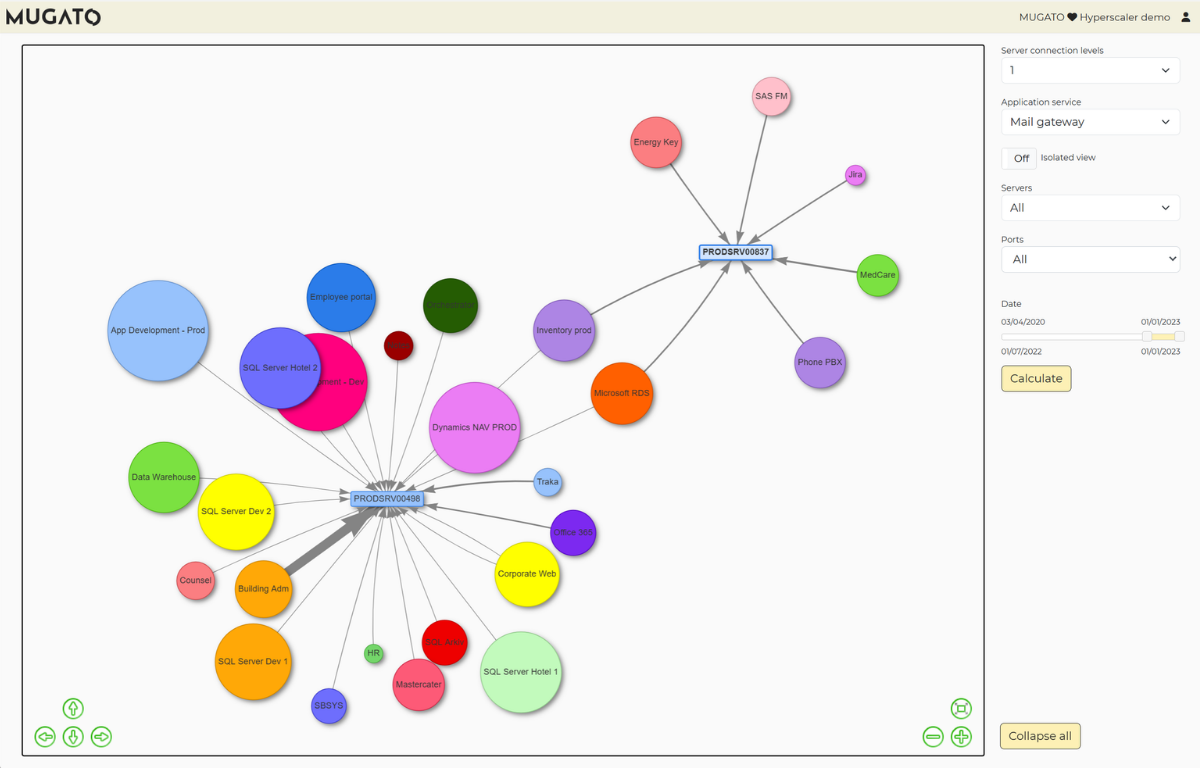
Mugato maps every communication pattern, data flow and service relationship, showing exactly which business capabilities depend on each server before any decommissioning decision is made. Blast radius analysis quantifies the precise downstream impact, so consolidation decisions are safe to execute.
Full temporal dataset
Hourly or daily averages mask utilization peaks. Two-week snapshots miss batch processes, seasonal peaks and growth trends.
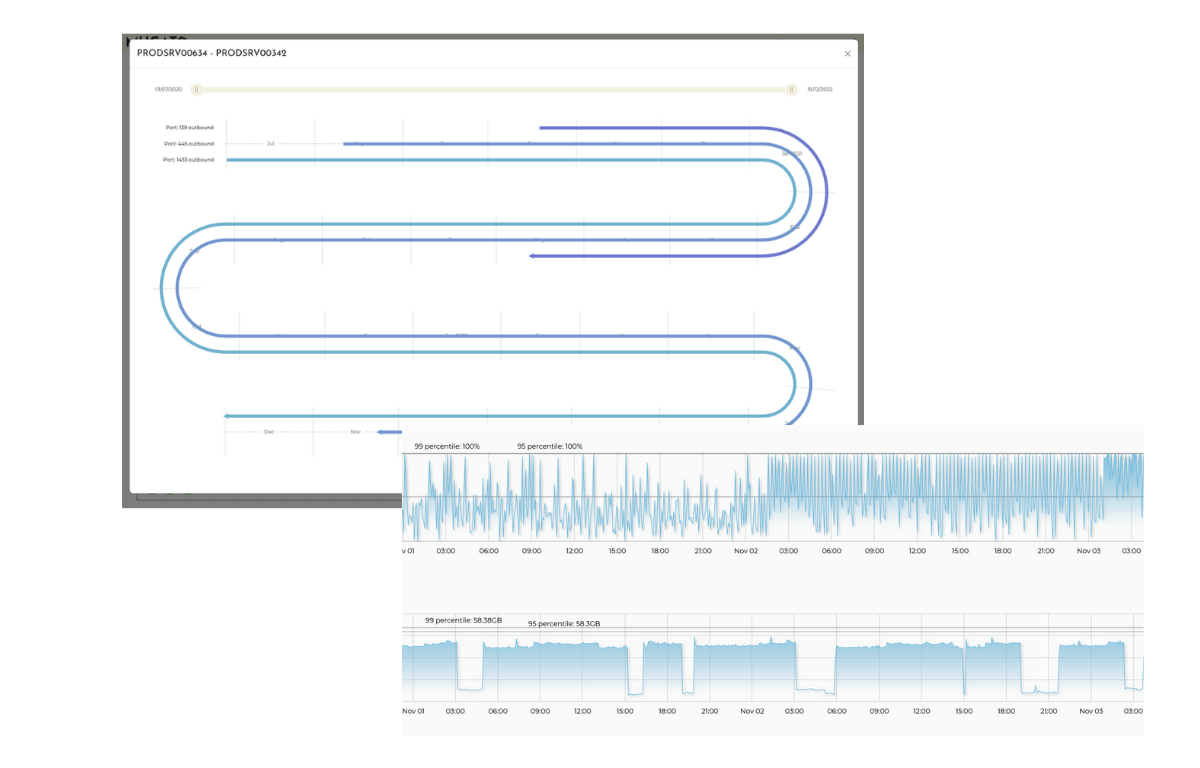
Mugato’s minute-granularity collection retains the complete behavioral history of every infrastructure component, capturing consumption patterns, seasonal variations, scheduled batch processes and growth trends. Meta-information that is never aggregated ensures rightsizing reflects actual demand, not smoothed approximations.
Business-service-linked cost allocation
Teams can’t attribute infrastructure costs to specific applications or business units, making chargebacks and vendor negotiations impossible.
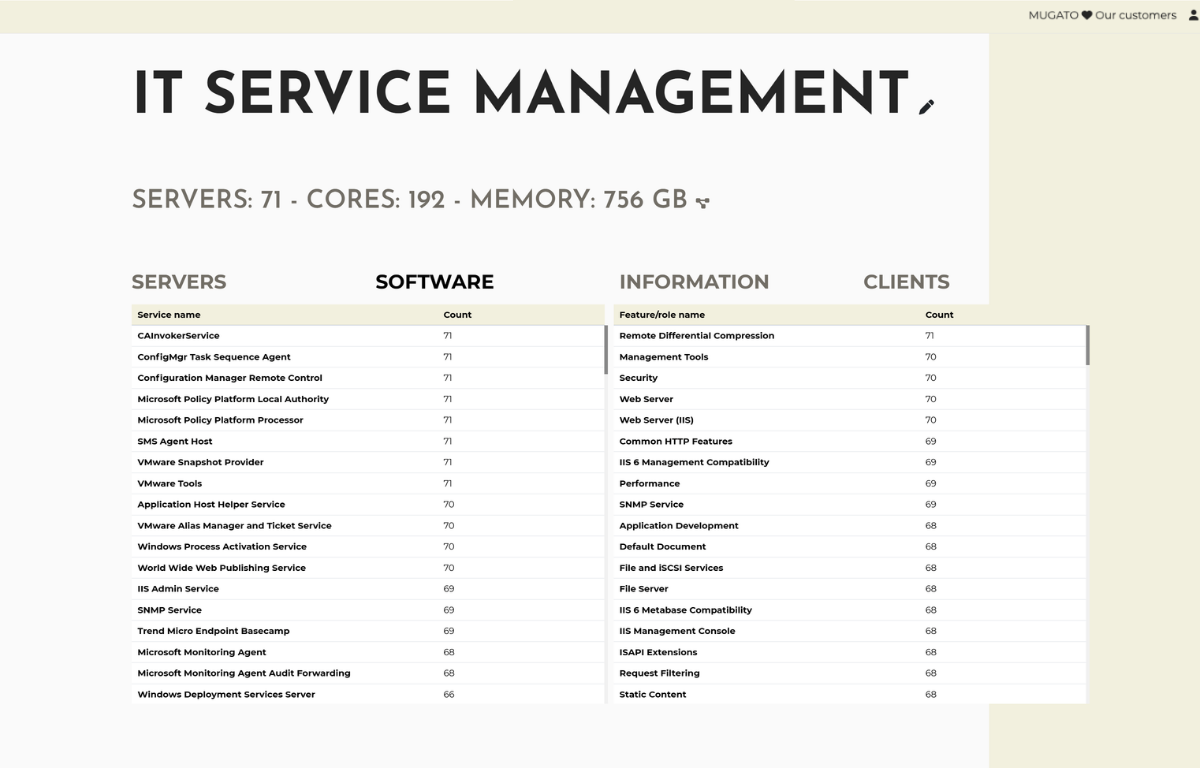
Mugato automatically groups application services into business services, connecting infrastructure costs to the business capabilities they support. This application-centric view surfaces hidden cost drivers and enables license rationalization, providing FinOps and sourcing teams with the data they need for chargebacks, vendor negotiations and license optimization.
Key Outcomes
20-40%
Identify significant spend reduction through zombie server elimination, rightsizing and license optimization.
0
Dependency mapping ensures cost savings are not erased by outages and credibility damage from blind decommissioning.
7
Every infrastructure component assessed across compute, tech debt, security, licensing, management, hardware age and consolidation opportunity.
24/7
Continuous collection means rightsizing always reflects your current environment, not a stale snapshot from months ago.
See cost optimization in mugato
This walkthrough shows how Mugato reveals every source of infrastructure waste and connects it to the business service it supports.
PAIN POINTS VS. PAINKILLERS
See how Mugato addresses the most common cost optimization challenges.


What customers say about Mugato
My favorite thing about Mugato? Mugato revealed that my service provider was overcharging me on capacity utilization. We could immediately show that we could lower the number of servers and there was so much money in that exercise that we immediately had a surplus on our Mugato investment.

With company mergers, there is often a need to be able to look ahead, but in order to do so, it is necessary to be able to look backwards at the same time. With Mugato I get just that opportunity.

Most companies out there are using agents. Our biggest problem is that our servers are already pressed to the maximum. With Mugato, you don't need to do anything. Just install the collector on a server, create a user, and you can start collecting information.

Ready to see the
shape of your it?
Stay ahead with Mugato: get product updates, event invites,
expert insights and more. Or let us show you how Mugato
can map your entire IT landscape without a single agent.